

Lux: Always-on Visualization Recommendations for Exploratory Data Science, Doris Jung-Lin Lee et al., VLDB (To appear)
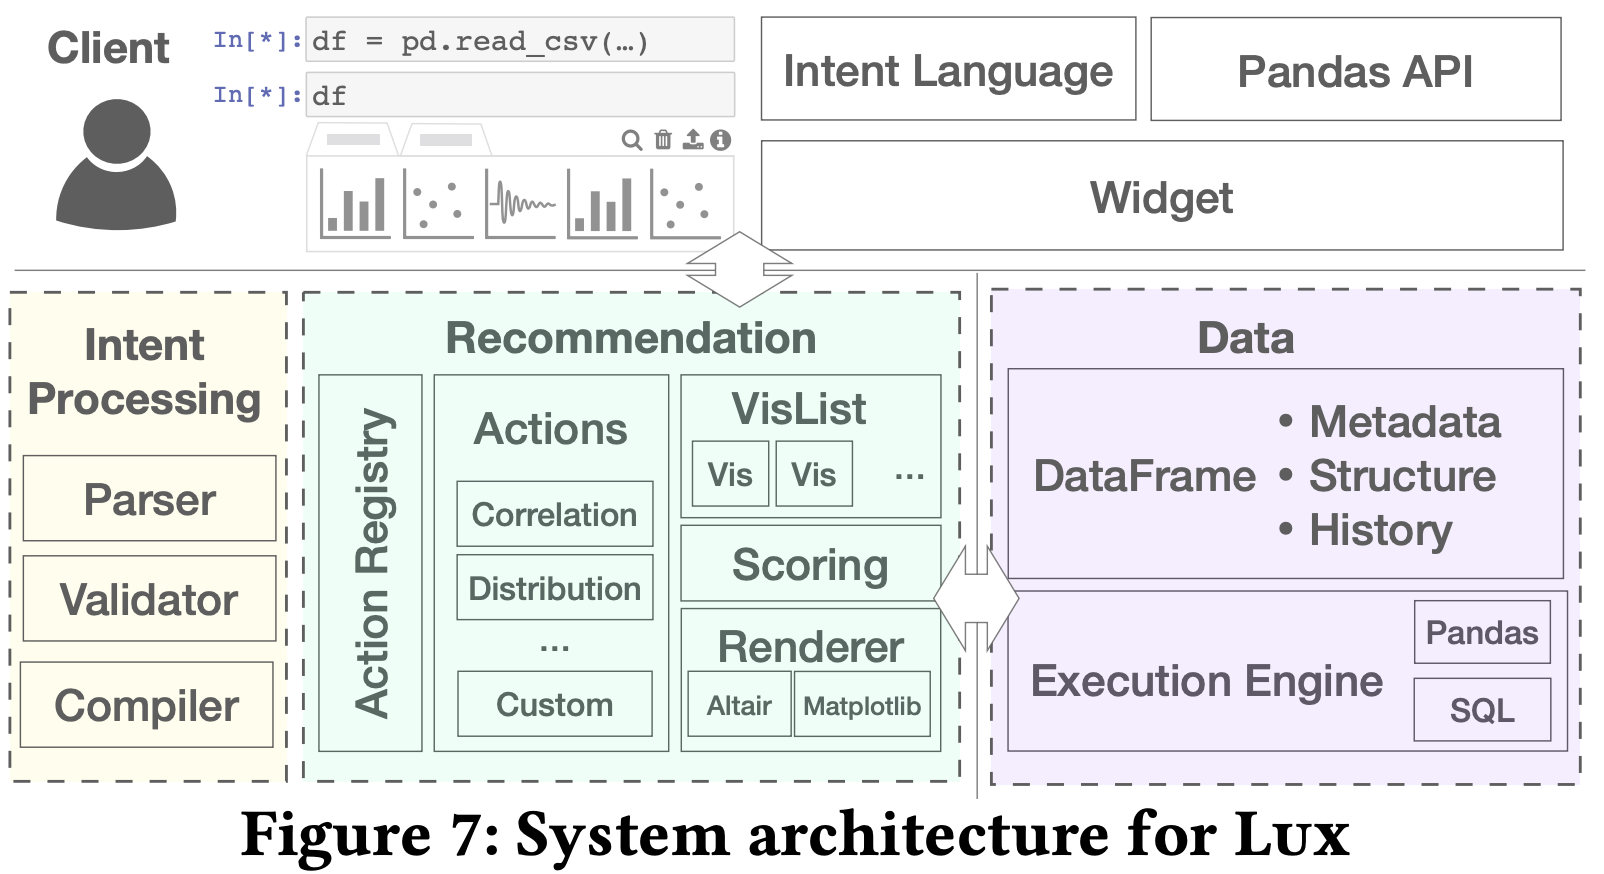
I have been following the Lux system for a while, and I am very happy to see that the work finally got published. It is an extremely sophisticated piece of software that recommends visualization of a tabular data frame inside a computational notebook, which requires an always-on recommendation throughout the data exploratory process. It means that when a data frame changes (e.g., data cleaning, columns being mutated, etc.), the system updates its visualization recommendations. The core idea of the system starts with an intent (i.e., columns and rows constructing the axes and axes’ values of the visualization), and then it pre-computes and stores a set of statistics and visualization recommendations based on the intents, indexes, and histories of user interactions. The whole set of recommendations updates when the data frame changes and/or users want to visualize the data based on different cases. The whole architecture is shown below:
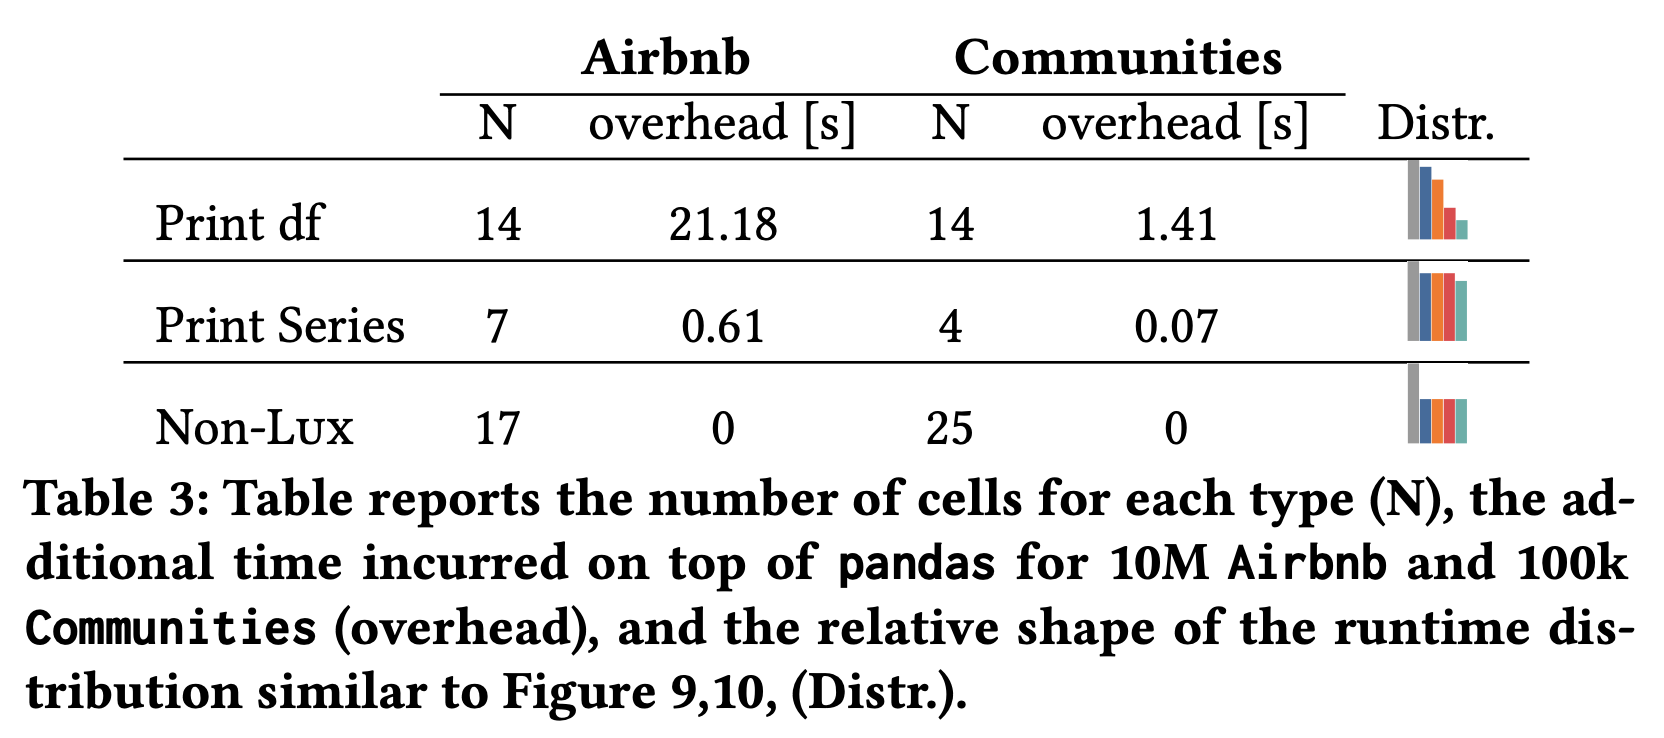
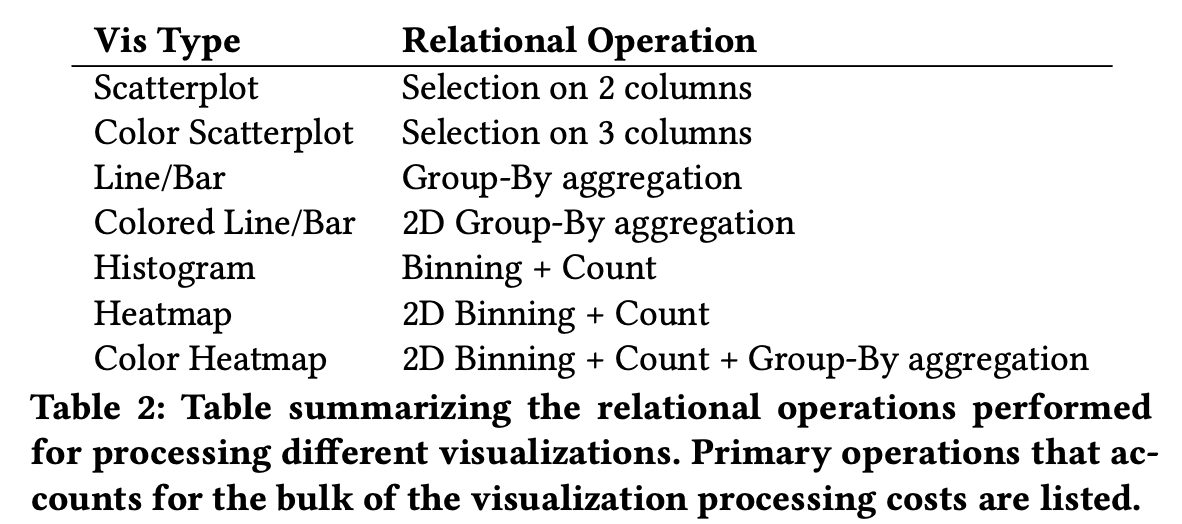
To understand why Lux is such great work, we need to answer a seemingly naïve question: why couldn’t we just compute a list of visualization recommendations based on the current state of the data frame, as there are already lots of current work available for that (e.g. Voyager)? The answer, from Lux, is latency. The computation advantages of keeping track of user interactions on the data frame and notebook explorations are as follows. First, it allows caching to reuse the recommendations. Second, it enables scheduling based on the costs of computing statistics and visualization. One interesting fact that the paper mentions is that users normally spend 28 seconds before generating a new visualization. Therefore, Lux can make use of this time to prepare some statistics and visualization data. The preparation consists of ranking the time to compute the statistics and visualization data and the computations of this information sorted by the ranks. The table below shows some interesting bottlenecks for computing each visualization, which I think is often overlooked by many visualization work:
The experiments show that Lux only needs a couple of seconds overhead and reasonable time to prepare the information upon printing the data. A very detailed talk of the whole work can be seen here.