

Atlas: Grammar-based Procedural Generation of Data Visualizations, Zhicheng Liu et al., IEEE VIS 2021
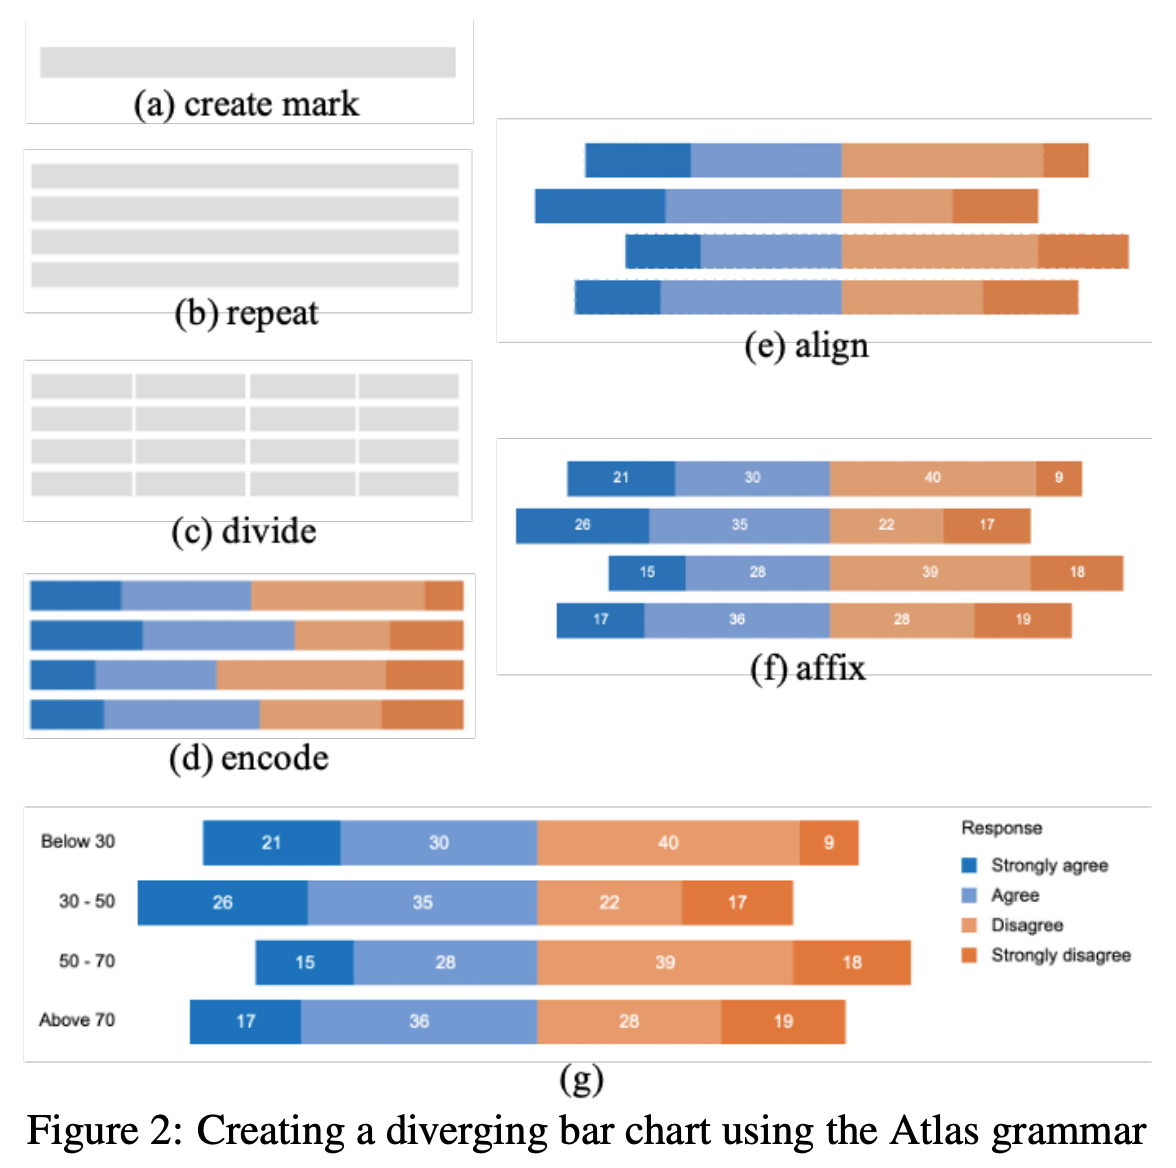
Today I was swamped by the CHI review deadline, so let’s look at something light and short. Atlas is an new and exciting visualization grammar that is graphic-centric. For a bit of context, most visualization grammars nowadays like Vega-Lite are data-oriented. Data analysts mainly work on the data specification (e.g., defining columns for the x/y axes) to generate charts. However, Atlas works more from a designer’s perspective. It first creates graphics (e.g., circles/ rectangles). Then the graphics repeat or splits according to some attributes from the data, and lastly, the positions or colors of the graphics bind to other attributes in the remaining data. The below is an example.
I am not going through all the steps in the pipeline, but it is worth mentioning that the core philosophy of Atlas is that every visualization can be started from a line, circle, or rectangle. The only thing you need next is to know how to repeat/ split/ densify them, which is illustrated below:
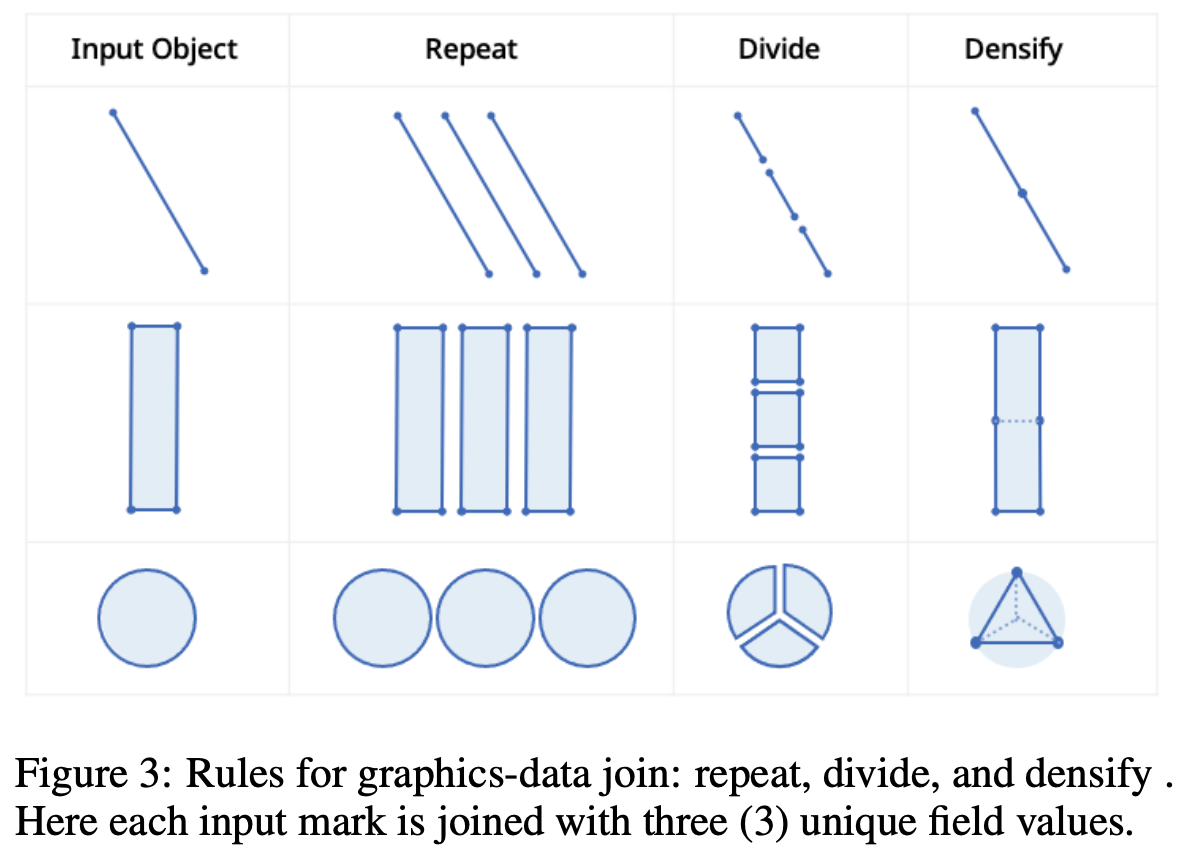
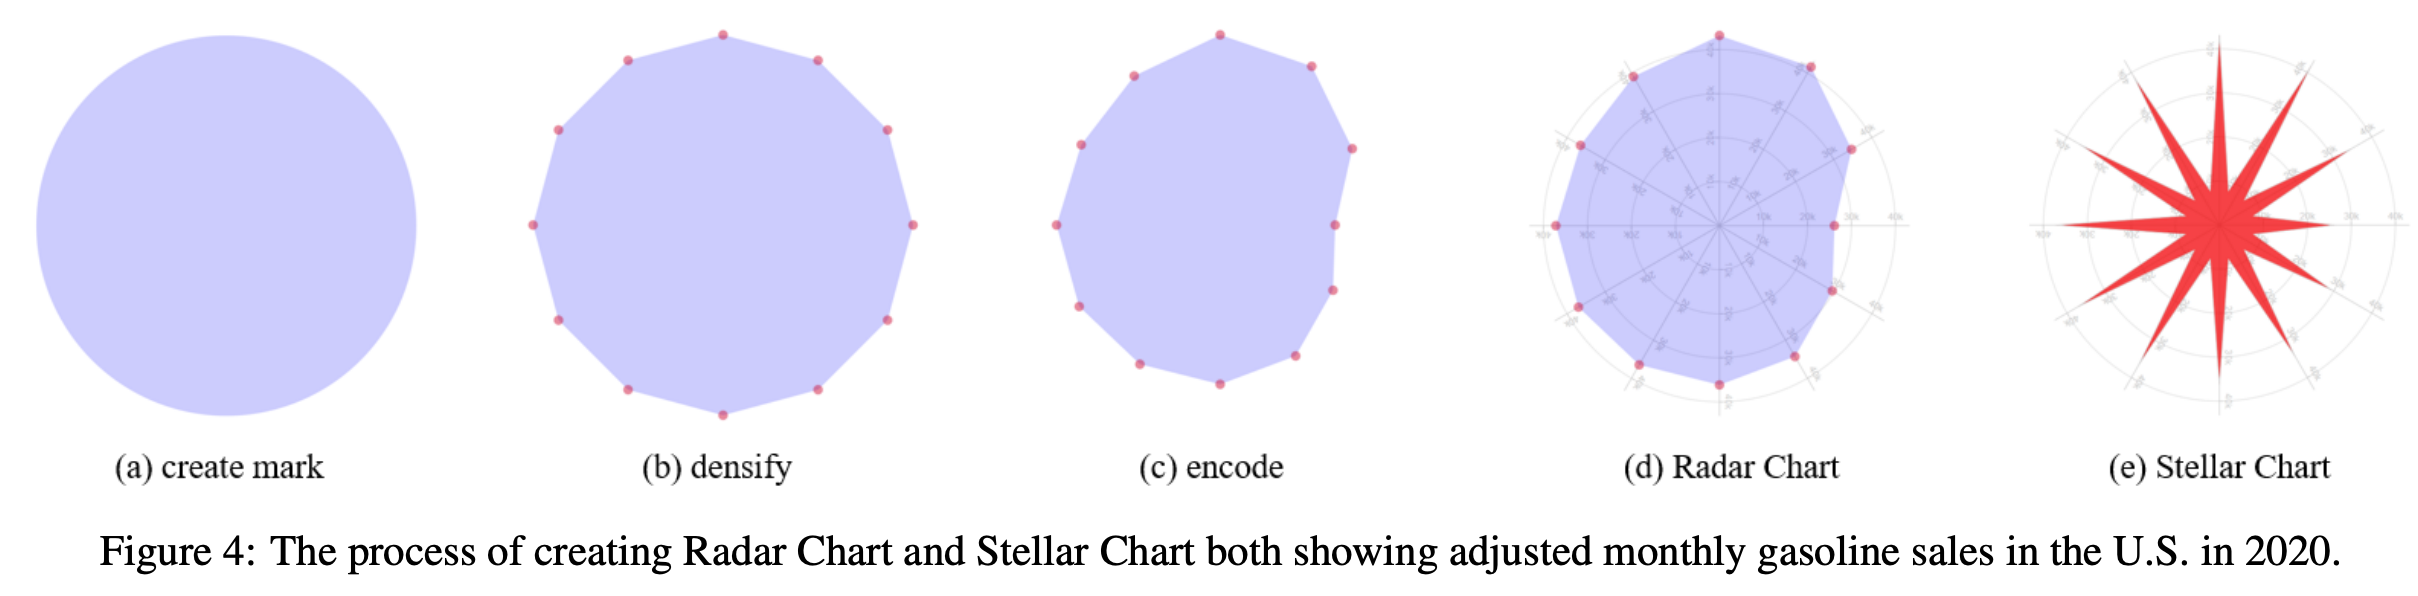
Once it is done, the graphics now contain “ports” to map to the data, in which we can now adjust the encodings and positions with the data values. The core advantage now is that we do not need to define a new mark for fancy charts. For example, a violin plot is a densified rectangle, and a star plot is a densified circle. It makes Atlas be more concise than other data-oriented visualization grammars.
The following shows an example of how to turn a circle into several plots. As we can see, the transformations among different plots have no changes on the number of graphics objects. I guess such provenance may enable lots of possible features like animations and visualization recommendations in the foreseeable future.